eLEAF - Water Consumption Dashboard
Blog written by eLEAF. The views and opinions expressed in this blog are those of the author(s).
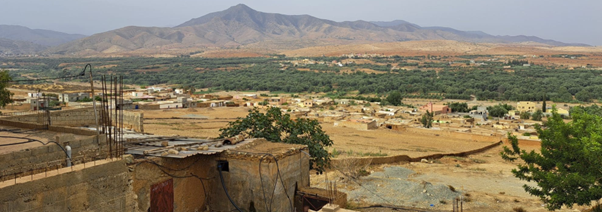
Figure 1. Agricultural fields in the Haouz province , Marrakech Safi region, Morocco ( september 12 2022) source: Resing
Water scarcity is a major challenge in Morocco, as the country experiences limited and declining rainfall and high levels of water demand from various sectors, including agriculture, industry, and urban use. This has led to overexploitation of water resources and declining groundwater.
We emphasise the importance of data in decision-making. When we can quantify and track water scarcity metrics, we can better understand the situation and identify areas for improvement. In the context of water scarcity, accurate data on water consumption is critical to inform decision-making. Therefore, in this Open Geodata Challenge, eLEAF and its partner Resing developed an online geographical Water Consumption Dashboard to accurately quantify water consumption in agriculture. The dashboard was co-developed, through comprehensive user need assessments and feedback, with Tensift River Basin Agency (ABH-T) and the Regional Office for Agricultural Development of Haouz (ORMVA-H) to support their water management and governance decisions.
The dashboard translates complex geo data of FAO's open-access WaPOR database and high resolution data (based on open data) into tangible information that can be directly used for reporting, decision making and planning. The information provided is intended to be easy-to-digest and aimed at professionals without prior GIS experience. The dashboard provides users with actual information every ten days. Also, the dashboard is customisable and user-definable so that the users can compare various periods and geographical locations for their analysis.
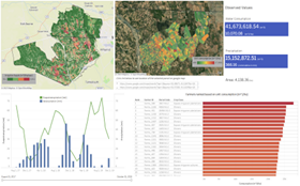
Figure 2. Water consumption dashboard showing water consumption at irrigation sector level individual parcels
Our services respond to the following user needs of ABH-Tensift and ORMVA-H.
- Comparison of planned versus actual water consumption
- Discharge and recharge insights into groundwater storage
- Water use exceedings or non-compliance with the growing of specific crops; directing the water police to violations
- Monitoring groundwater (borewells) authorisations
- Evolution of irrigated area over time
- Evaluation of development interventions such as the impact of collective conversion to drip irrigation method
- Mapping of irrigation/on-farm reservoirs
In this way, our dashboard enables users to improve water use efficiency and ensure equal and inclusive access to water for all stakeholders. Subsequently, benefiting smallholder farmers in fair water distribution and improved irrigation practices with expected higher impacts on their crop yield, lower water footprint and enhanced farming profitability.
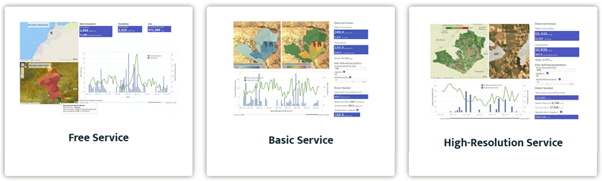
We offer multiple service subscription plans to meet customer needs and different spatial scales ranging from aquifer, commune and field level for more information see our website.
With this Open Geodata Challenge from NSO we have been able to develop a prototype of our Water Consumption Dashboard with our partner Resing and our clients ABH-T and ORMVA-H. We have demonstrated it to various other water and agriculture authorities at directors level. The sessions with Bopinc were very useful, because they enabled us to step out of the technical work. We worked on customer insights, client’s pains and gains, impact both business wise and for smallholder farmers and our value propositions.
We have gained a lot of interest in Morocco. Meanwhile, an extended demonstration phase would be useful to let our customers experience the dashboard for a certain period for free and further adapt our service to user actions. For our business this is the best marketing strategy to let it be adopted by user experience and scaled by these users to other water and agriculture authorities.
eLEAF is exploring options for further funding for this demonstration phase.
![]()
![]()
![]()